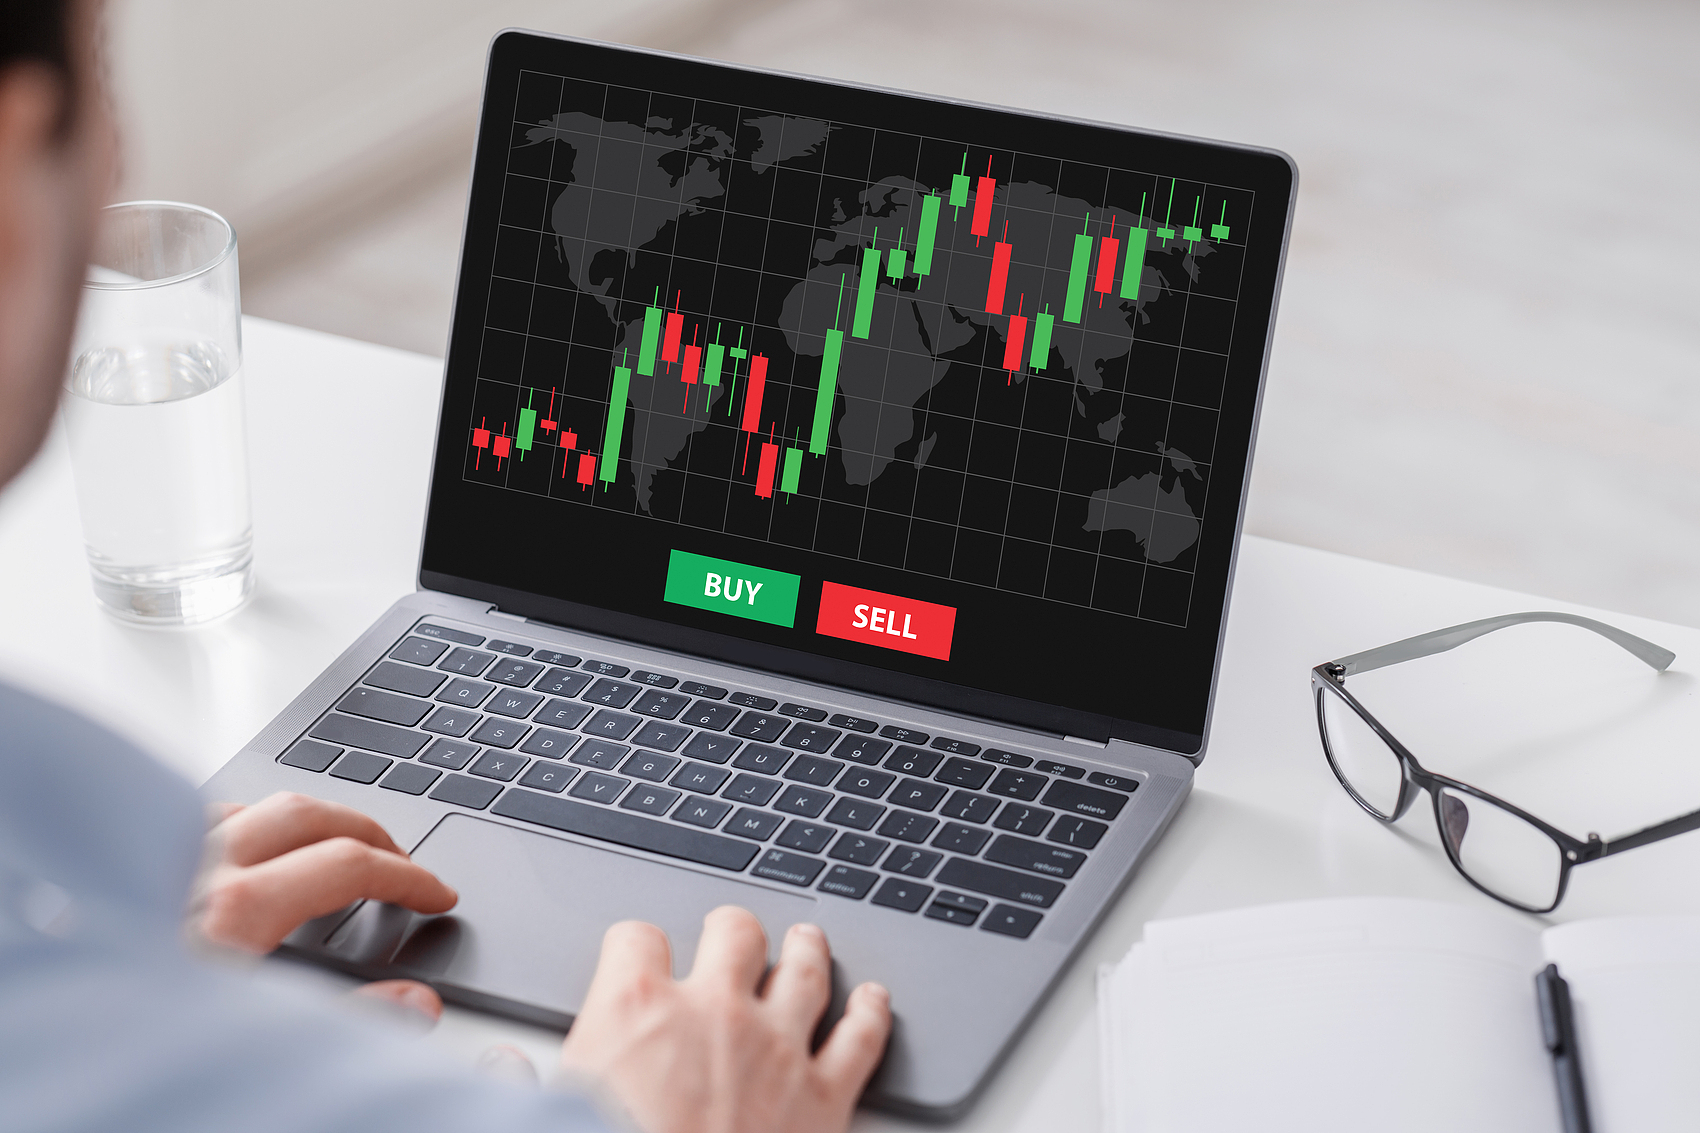
Must-read before copy trading with ACE : How to assess the risk appetite of signal providers?
In today's increasingly popular copy trading market, many users focus on "high-yield signal providers," but overlook a crucial question: do their risk tolerance match yours? High returns are often accompanied by high volatility; aggressive strategies may shine in a bull market, but quickly retreat in a volatile or declining market. ACE Markets believes that successful copy trading is not about chasing the highest returns, but about finding signal providers whose risk tolerance aligns with yours. This article will teach you how to assess their risk tolerance using objective data and introduce how ACE Markets provides transparent tools to support this decision.

Why is risk appetite more important than return?
Returns are the result, but risk appetite is the root cause of behavior. A signal provider who consistently uses high leverage, frequent heavy positions, and lenient stop-loss orders indicates a high-risk appetite—such strategies may yield monthly returns exceeding 30% in trending markets, but once the market reverses, a 20% drawdown in a single week is not uncommon. If you are a conservative investor, even if you profit from following their trades in the short term, you might exit prematurely due to significant volatility, ultimately "gaining on the index but losing on the experience."
Conversely, low-risk-tolerance providers typically use small positions, strict stop-loss orders, and low trading frequency, with annualized returns possibly only reaching 10%-15%, but maximum drawdowns controlled within 5%. While this strategy may not be flashy, it's easier to hold onto positions and follow it for longer. Therefore, before copying trades, always ask yourself: "How much volatility can I tolerate?" and then select suitable signal sources accordingly.
How can ACE Markets help you see the true risks of signal providers?
ACE Markets displays six core risk indicators on its signal provider homepage, all calculated based on historical live trading data, rejecting any embellishment or simulation:
Maximum historical drawdown: Reflects the worst consecutive loss magnitude; Average holding time: Short-term high-frequency vs. long-term low-frequency, style is clear at a glance; Median leverage usage: Not the peak, but the commonly used level; Win rate and profit/loss ratio: High win rate and low profit/loss ratio vs. Low win rate and high profit/loss ratio, different strategy logic; Risk score (1-10 points): Generated by the platform's comprehensive volatility, leverage, and product concentration; Account consistency: Whether the strategy is frequently changed or the position size is suddenly increased.
All data supports monthly/quarterly filtering to avoid being misled by short-term "luck." For example, a provider may have achieved a 50% return in the past three months, but its maximum drawdown reached 35%, resulting in a risk score of 9—clearly unsuitable for conservative users.
How can I use a "risk profile" to match myself?
ACE Markets recommends that users first complete a personal risk assessment (available free of charge on the platform) to generate their "risk tolerance level" (e.g., conservative, balanced, aggressive). Then, using the "risk matching filter" on the signal list page, the system will automatically recommend providers that match your risk tolerance level.
For example, if your assessment result is "balanced," the platform will prioritize displaying signals with a risk score of 5-7, maximum drawdown <15%, and leverage ≤1:50. You can still view high-risk options, but you will receive a clear warning: "This strategy is highly volatile and may exceed your risk tolerance."
Beware of the "profit illusion": Seeing through the beautified data
Some platforms only display the "cumulative return curve," concealing sharp fluctuations in between. ACE Markets, however, mandates the display of a complete net asset value chart with drawdown shaded areas, and highlights significant loss events (such as "18% drawdown in a single week in March 2025"). Furthermore, all signal accounts must be real copy trading accounts; the use of demo accounts or hedging accounts is prohibited.
Users can also click "Transaction Details" to view the opening and closing times, instruments, lot sizes, and profit/loss for each historical order. If a provider is found to frequently place heavy bets on news items or maintain a fully invested position in a single instrument for extended periods, it indicates an aggressive risk appetite, and even if current returns are high, careful evaluation is necessary.
In conclusion: Copy trading is not about replicating profits, but about matching the trading rhythm.
At ACE Markets, we believe that the key to long-term profitability is not choosing "the most profitable people," but rather choosing "people who can sleep well like you." Through transparent risk data, a scientific matching mechanism, and complete trading records, the platform helps you see beyond the surface of returns and understand the true risk preferences of signal providers. Only by aligning with their pace can you go further.
The content of this article is spontaneously contributed by Internet users, and the views expressed in this article only represent the author himself. This website only provides information storage space services, does not own ownership, and does not assume relevant legal responsibilities.https://www.aneimedzi.cn/html/358.html